

This is the fourth article in Ground Truth, a five-part series by Jim Featherstone on the structural challenges of crisis and emergency management.
The common operating picture is how multi-agency responses build shared situational awareness: one display that every agency works from. It solves a real coordination problem, but creates another, because that single display is almost always built by and for the lead agency. Everyone else reads the event through someone else's lens. This essay argues for a different structure. Share the data. Let each agency own its picture. Coordinate at the data standard instead of the screen.
A Picture Is Worth a Thousand Data Points
The old aphorism goes: a picture is worth a thousand words. In crisis and emergency management, the working version is sharper. A picture is worth a thousand data points.
Consider the telephone book. For most of the twentieth century, it was one of the largest data sets most people ever held in their hands: millions of names, addresses, and phone numbers, exhaustively compiled and updated every year. Big data by the standards of its era. It was also nearly useless for anything beyond looking up what you already knew.
You could not ask a telephone book where elderly residents are concentrated in a neighborhood, which blocks have the most households without vehicles, where non-English speakers cluster, or where service coverage has gaps. The data to answer every one of those questions was in the book. The alphabetical, linear, and non-spatial display simply made them unanswerable.
Geo-enabled visualization changed that. The same information, rendered spatially and layered with other sources, showed patterns, concentrations, and gaps that no amount of alphabetical searching could surface. The data did not change. The display did, and with it the range of questions a person could ask.
This essay is about that shift from data to insight, and about a narrower claim that follows from it. The model crisis and emergency management uses for shared visualization, the common operating picture, limits what different agencies can see. A better architecture is available.
What Geo-Enabled Data Does That a Table Cannot
A table of incident addresses tells you where things happened. A heat map of the same incidents tells you where they cluster, often in places that surprise practitioners who thought they knew their operational area.
Layering adds more. Put utility infrastructure over population density, evacuation route capacity, and shelter locations, and the overlap shows things no single layer can. That overlap is where the operational intelligence lives.
Time adds more again. One damage assessment snapshot is informative. The same data played across weeks of recovery shows the pace of restoration and which neighborhoods are falling behind, information that leaders need for both operational and political reasons.
Once the pattern is visible, the question moves from what happened to what is likely to happen next, and where. That move from after-action awareness to anticipation is what makes a map worth building.
Data tells you what. Geo-enabled visualization tells you where, how much, and in relation to what else. The telephone book had the data. The heat map has the insight.
The Common Operating Picture Problem
The common operating picture emerged from a legitimate need for shared situational awareness. In multi-agency, multi-jurisdiction responses, everyone has to work from the same factual baseline, and coordination fails when agencies operate from different pictures of conditions on the ground. The National Incident Management System builds the COP into incident management for exactly that reason: a shared overview that lets command and supporting agencies make consistent, timely decisions.
It has not solved the problem. The reason is structural.
One Picture, One Lens
The traditional COP assumes a single display can serve every agency at once. In practice, that display is designed by and optimized for the dominant agency or jurisdiction: the lead federal agency, the largest jurisdiction, or the organization with the most resources and control over the display architecture.
Everyone else reads the event through that lens. The information is nominally there. But the layers chosen, the symbology, the geographic resolution, and the features emphasized all reflect the priorities and operational culture of whoever built it.
Picture a cone sealed inside a cube, with a peephole cut into two of the faces. Look through the side, and you see a triangle. Look up from the bottom, and you see a circle. Both observers are accurate, and neither sees a cone. The COP gives every agency the same peephole, cut by one agency at the table for its own purposes.
The Street Example
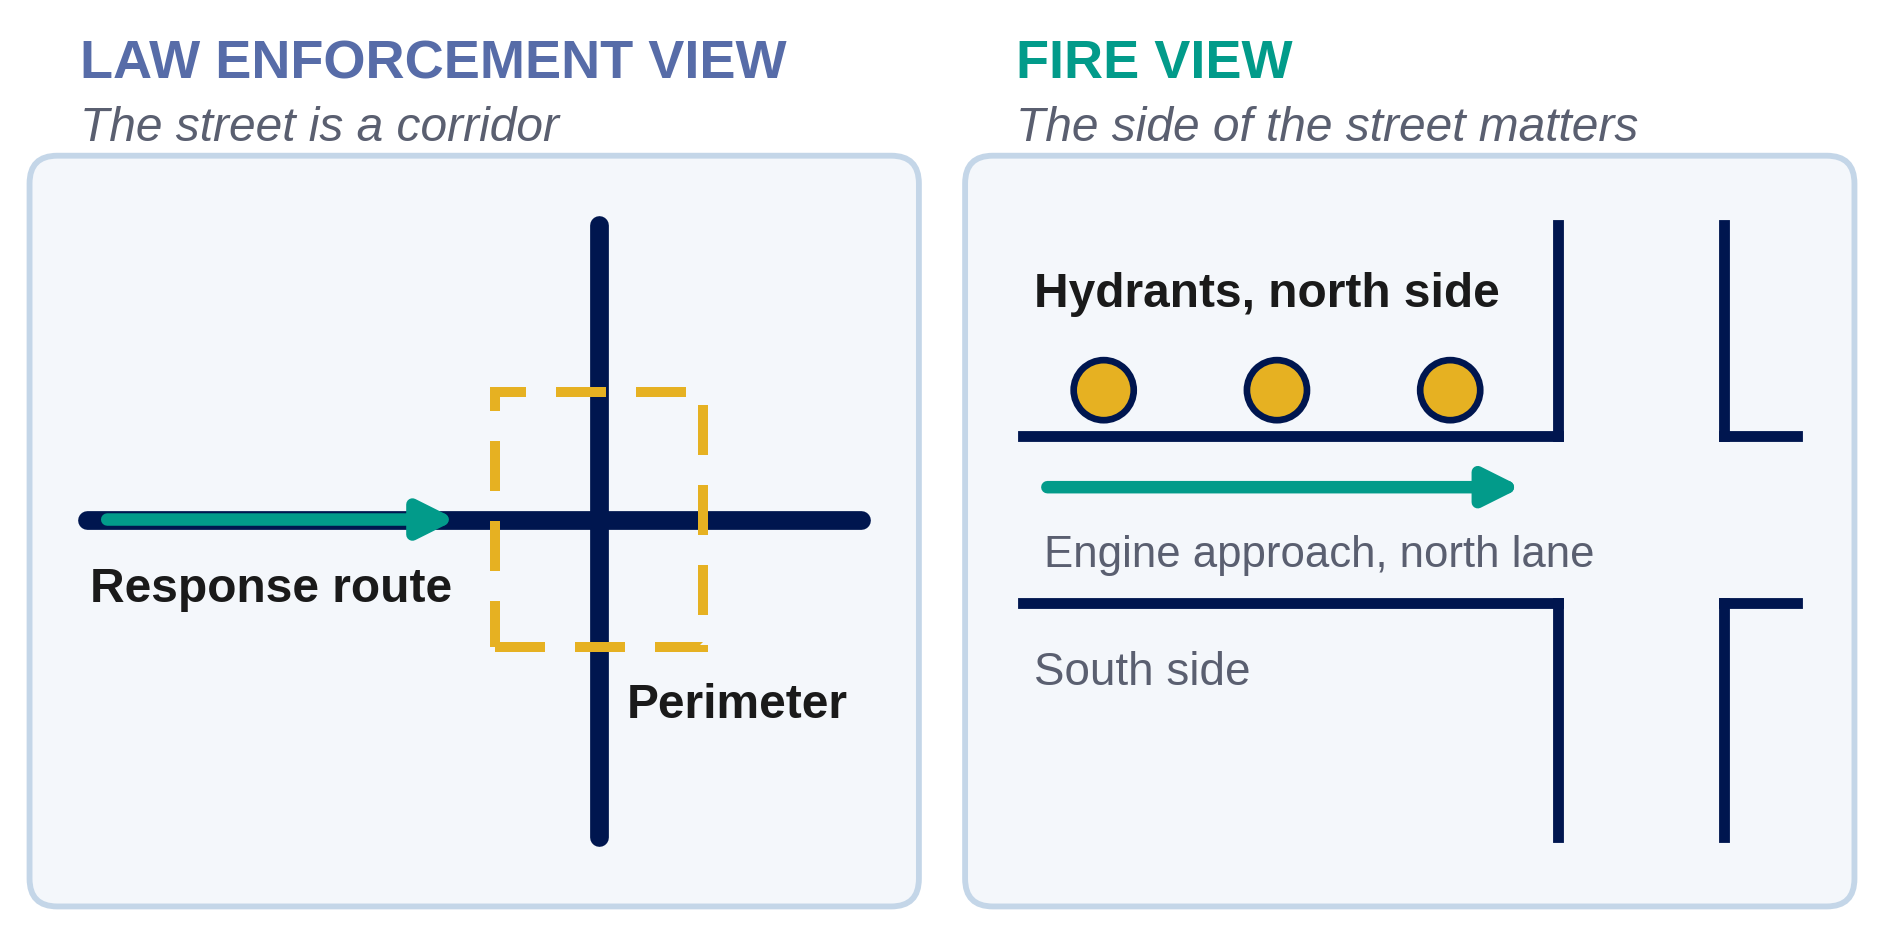
Law enforcement operational maps draw a street as a single line. For their purposes, that is correct. Routing, perimeter management, resource deployment, and traffic control all treat the street as a corridor.
Fire department maps draw the same street as two parallel lines, because the side of the street matters. Hydrant placement is side-specific, and an engine company needs to know whether the hydrant is on the north or the south side of the block before it commits to an approach.
Neither convention is a stylistic preference. Each follows directly from mission, roles, and responsibilities, and a single COP that draws streets one way serves one agency at the other's operational expense.
Multiply that across every agency at the table: public health, public works, utilities, transportation, mutual aid partners, voluntary organizations. No single display can be optimized for all of them. In trying to serve everyone, the traditional COP often serves no one fully.
Same Data, Different Stories
There is a quieter problem underneath. The choice of what to display, at what resolution, in what geographic unit, and with what symbology is never neutral. It tells a story, and the story reflects the assumptions of whoever designed the display.
A damage assessment map built on county parcels tells a different story than one built on census tracts. A recovery dashboard that tracks permits issued tells a different story than one that tracks households with utilities restored. A deployment map that shows units assigned tells a different story than one that shows response times.
None of these views are wrong. All of them are partial. The open question is whose story the dominant picture tells, and whose operational reality it leaves out.
Common Data, Mission-Specific Pictures
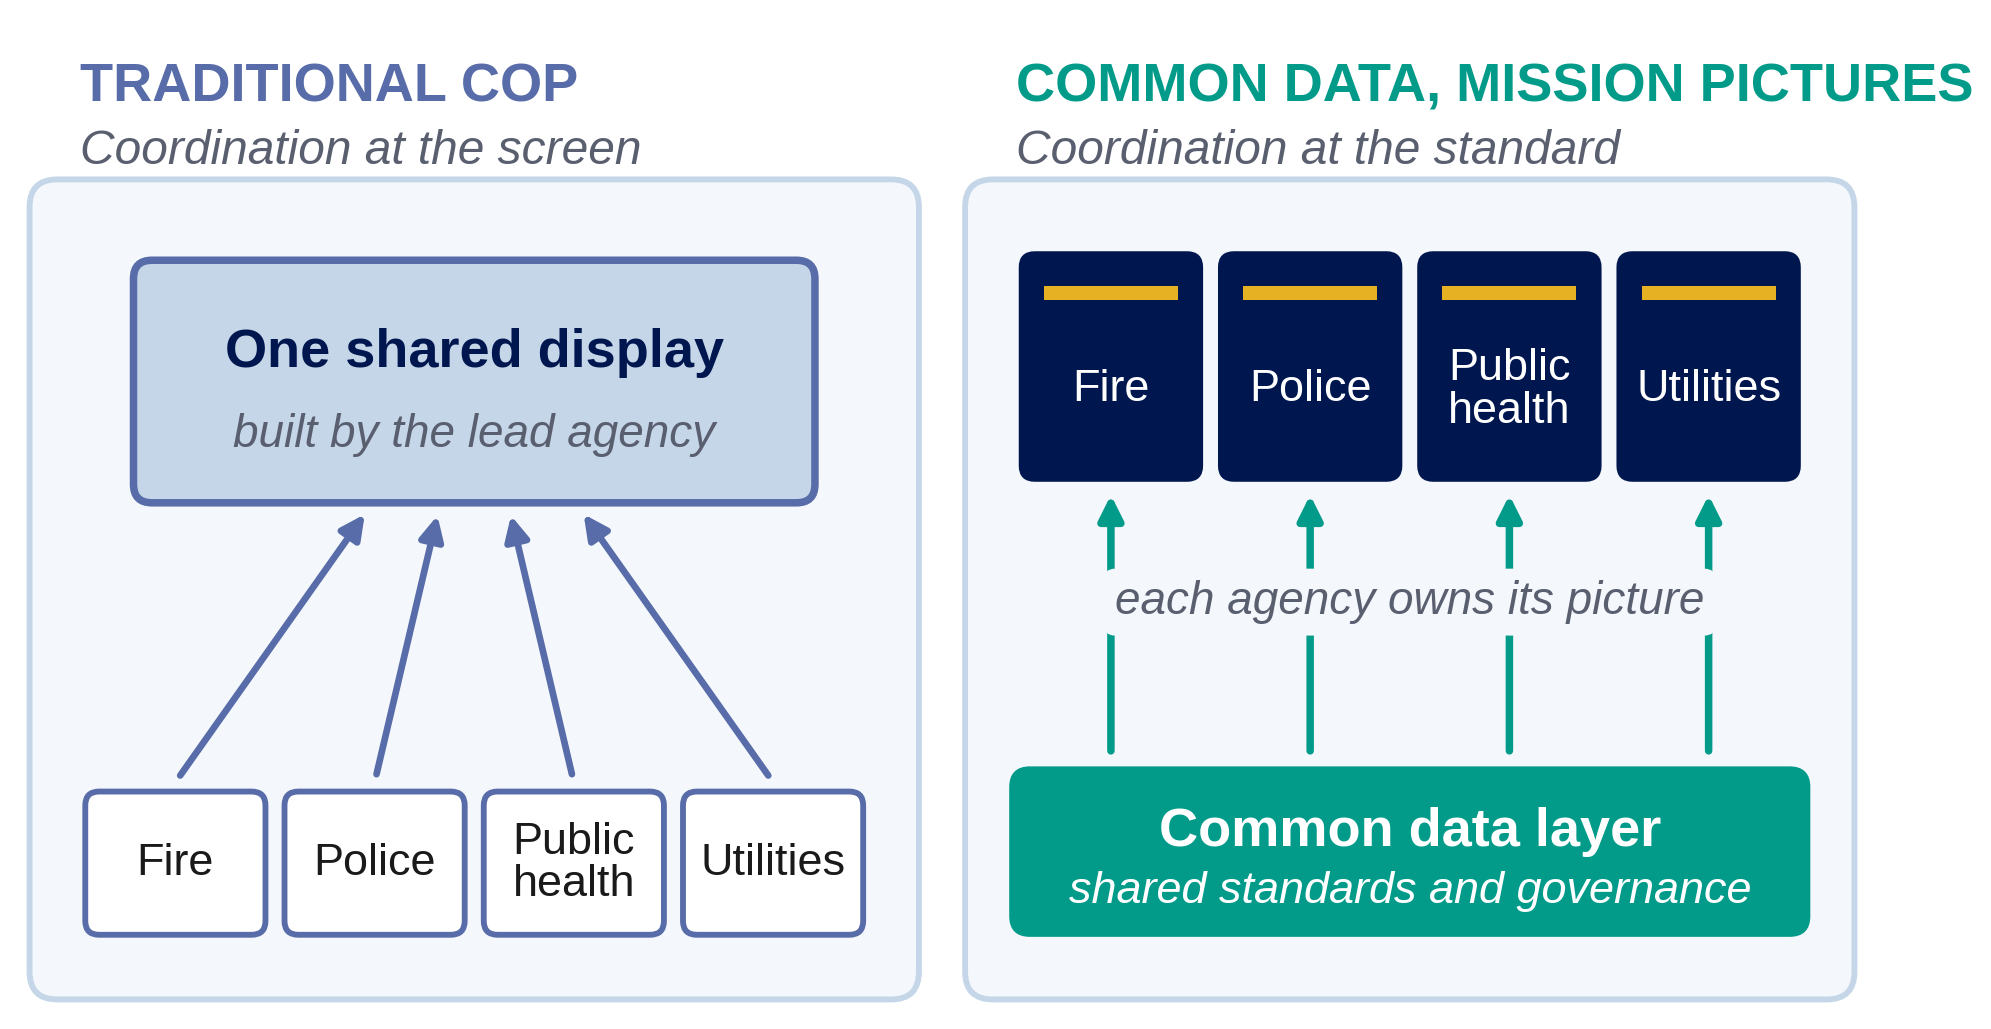
Shared situational awareness is still the right goal. What needs to change is where the sharing happens.
The data layer is shared, standardized, and interoperable across agencies and jurisdictions. Incident locations, infrastructure status, population data, resource deployment, damage assessments, and weather all feed one common architecture, supplemented by shared data feeds that every participant can reach.
The display layer belongs to each agency. Fire's picture shows two-line streets and hydrant locations. Law enforcement's shows single-line streets and jurisdictional boundaries. Public health's shows population vulnerability and medical facilities. Public works' shows infrastructure networks and debris removal zones. Each is tuned to its own symbology, resolution, and operational tempo.
These are different pictures of the same event, built from the same data. Coordination happens through interoperability standards, shared feeds, and common data governance rather than through a common screen.
What This Changes Operationally
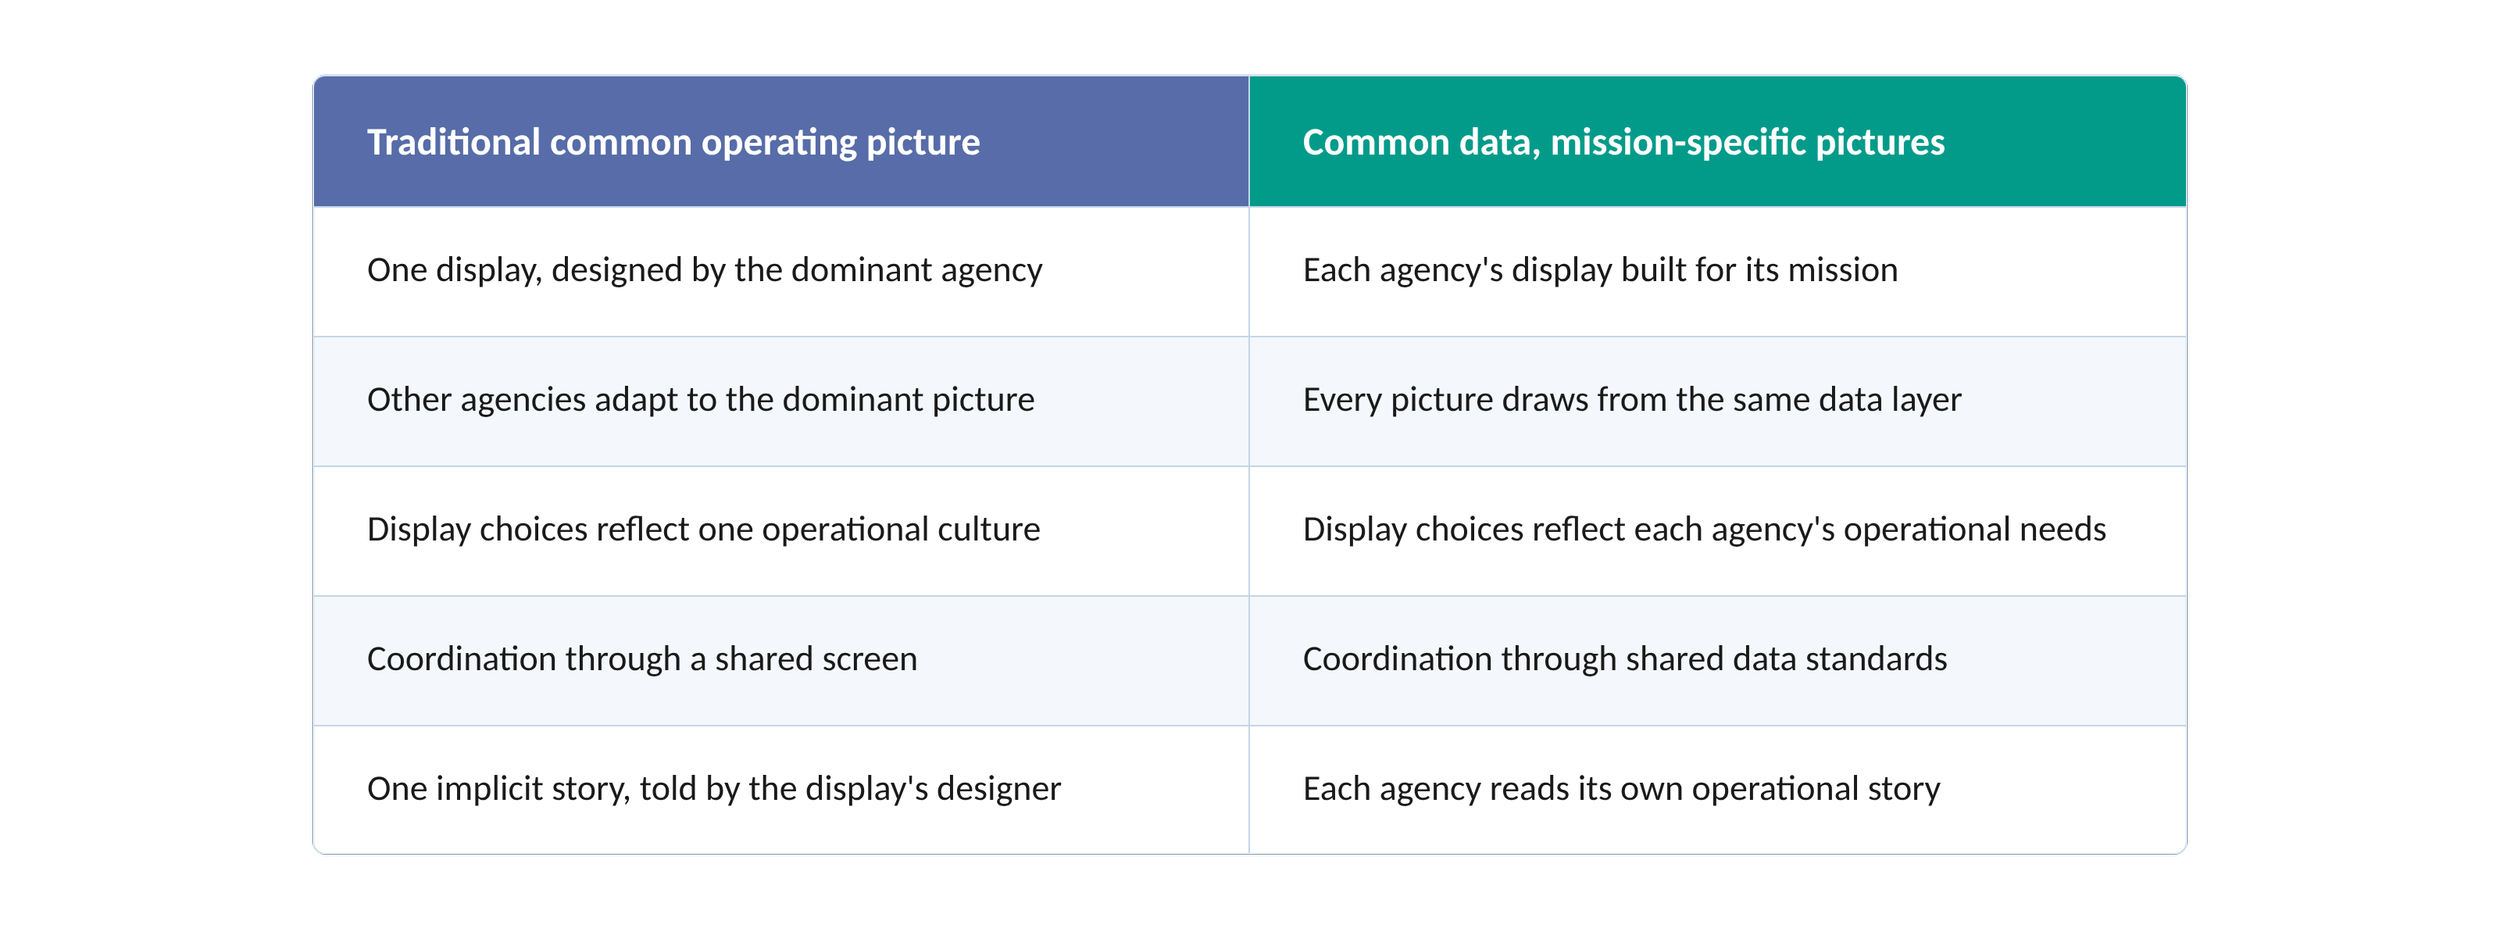
The practical effect is that data interoperability becomes the standard for coordination.
Agencies invest in keeping their data compatible and current instead of learning to read someone else's map.
What This Requires
The federated model makes its own demands.
Common data standards: agreed definitions, formats, and update protocols, so the same underlying data supports every display accurately.
Data governance: clear ownership, authority, and accountability for each data layer.
Interoperability investment: the technical work of letting different display systems draw from common sources in near real time. Much of it can be configured on the GIS and productivity platforms agencies already license.
Leadership commitment: a deliberate choice to coordinate at the data layer instead of insisting on display uniformity, which is a governance decision as much as a technical one.
None of these are trivial. All of them are more tractable than the alternative: persuading every agency to give up the display built for its mission and work from someone else's picture.
Data Has Blind Spots, Too
The federated model solves the dominant-agency display problem. It does not settle what data gets collected, how it is structured, or whose reality it captures.
Data is never a neutral mirror of conditions on the ground. It is the product of choices about what to measure, how to measure it, at what resolution, how often, and with what resources, and those choices reflect the priorities and capacity of the agencies doing the measuring.
Communities with strong baseline infrastructure generate rich data. Communities without it generate weak signals. In a crisis, the neighborhoods best represented in the data are often the ones that were best served before it, and the people most in need can be the least visible in every agency's picture.
That is a red-slice problem, the subject of my last article, Shrinking the Red Slice. The communities whose needs the data misses sit squarely in what practitioners don't know they don't know. Inclusive collaboration is the human complement to the architecture proposed here. However well designed, the picture cannot replace the perspective of the people who live in the territory it depicts.
The Standard, Not the Screen
The common operating picture was built to solve a real problem. When agencies work from different factual pictures, coordination fails.
But a single display optimized for the lead agency and imposed on everyone else trades one coordination problem for another. It asks diverse agencies to read the event through a lens built for someone else's mission.
A picture is worth a thousand data points, but only if it is the right picture for the agency reading it.
The telephone book had the data. It took a different way of seeing to turn that data into insight. Crisis and emergency management needs the same move now: from one shared display to common data, and from one story to many mission-specific ones built on the same foundation.
Key Takeaways
What is a common operating picture in emergency management?
A common operating picture (COP) is a shared overview of an incident that lets incident command and supporting agencies work from the same factual baseline. The National Incident Management System treats it as the basis for consistent, timely decisions across the agencies and jurisdictions responding to the same event.
What is wrong with the traditional common operating picture?
The traditional COP is usually one display built by and for the lead agency. Every other agency reads the event through that agency's choices about layers, symbology, and resolution. A display tuned for one mission cannot also be tuned for fire, public health, public works, and utilities at the same time.
What does “common data, mission-specific pictures” mean?
Agencies share one standardized, interoperable data layer, while each agency builds and owns the display that fits its mission. Fire, law enforcement, and public health see different pictures of the same event, drawn from the same data. Coordination happens through data standards and governance rather than a shared screen.
Why do fire and law enforcement need different maps?
Law enforcement draws a street as a single line because it treats the street as a corridor for routing, perimeters, and traffic control. Fire draws two parallel lines because hydrant placement is side-specific, and an engine company needs to know which side of the block the hydrant is on before committing to an approach.
What does a federated situational awareness model require?
It requires common data standards and formats, clear governance and ownership for each data layer, interoperability work so different displays can draw from shared sources in near real time, and leadership willing to coordinate at the data layer instead of insisting on one uniform display.
Does shared data eliminate blind spots?
No. Data reflects choices about what to measure, where, and how often. Communities with weak baseline infrastructure produce weak data signals, so the people most in need can be the least visible in every agency's picture. Inclusive collaboration with those communities is the complement to any data architecture.
For Further Reading
Ground Truth 1, The Disaster Always Has a Vote, argues that fixed plans fail against conditions that will not hold still, and that adaptive frameworks outperform them.
Ground Truth 2, A Forced Fit: Why HSEEP Is the Wrong Framework for Executive Crisis Leadership, examines what happens when a compliance-driven validation framework is applied to a development challenge.
Ground Truth 3, Shrinking the Red Slice, makes the case for red teaming and Community Lifelines-based collaboration as the way to shrink what an organization doesn't know it doesn't know.
FEMA's National Incident Management System doctrine is the source framework for the common operating picture as used in U.S. incident management.
From Situational Awareness to Operational Awareness in EOCs examines how to extend shared awareness from the incident itself into the daily operations of an emergency operations center.
About James “Jim” Featherstone
Jim is a seasoned public safety and emergency management leader with over 30 years of experience. He began his career with the Los Angeles Fire Department in 1986 and later served as Interim Fire Chief. He was appointed General Manager of the Los Angeles Emergency Management Department in 2007, leading citywide preparedness and resilience efforts until 2016.
After retiring, he served as Executive Director of the Los Angeles Homeland Security Advisory Council, advancing regional collaboration across Southern California. In 2025, he returned to public service at the Mayor’s request to support Los Angeles’ wildfire response and recovery efforts. Jim currently serves as an Executive Consultant of Emergency Management for Bent Ear Solutions and is the founder and owner of Themata Strategic.
About Bent Ear Solutions
Bent Ear Solutions (BES) was built by emergency managers to help government agencies, enterprises, and critical infrastructure operators connect their existing technology investments to improve decision-making, efficiency, and resilience.
BES specializes in operationalizing frameworks, plans, and policies through an organization’s existing technology, supporting quick and accurate decision-making. This takes situational awareness to the next level by improving interoperability, cross-collaboration, and notification in the precise configuration your team needs.