

See the outage the moment it happens
The Bent Ear Solutions (BES) Power Outage Data Feed maps active outages as GIS polygons refreshed about every 30 seconds, drawn from a network of more than 1.3 million grid sensors, and delivers them as ArcGIS-ready feature layers.
Powered byTing (opens in a new tab)
- of US homes sit within a mile of a sensor
- 95%
- devices in the sensor network
- 1.3M+
- between outage updates
- ~30 sec
- new devices added each month
- 50K+
What it changes for an operations center
See the full footprint
Outage polygons cross county and utility lines, so your operations center sees the whole event in one layer instead of stitching utility maps together.
Layer it with what matters to you
Overlay outages on nursing homes, dialysis centers, and access and functional needs populations, then send welfare checks to the highest-risk blocks first.
Brief from one picture
Leadership briefings and mutual aid requests draw on the same live layer every partner sees, which ends the argument over whose numbers are right.

“Power outage data is often wrong, late, or missing key details. In a crisis, that's not good enough. If you're making decisions that affect lives and operations, you need data you can trust: fast, accurate, and complete.”
Compared with public outage data
| What you need | BES feed | Public outage data | What it means for the operations center |
|---|---|---|---|
| Update frequency | About every 30 seconds | Delayed or reported in batches | You see changes while they are happening |
| Spatial precision | Polygons that trace the affected area, with critical assets overlaid | General areas or ZIP codes | Response goes to the blocks that are dark |
| Data integration | Configured for ArcGIS, dashboards, and internal systems | Limited, with manual processing | The layer is usable the day it arrives |
| Asset overlay | Infrastructure and demographic layers on top of outages | Not available without manual GIS work | Priorities follow risk, not customer counts |
| Alerts and routing | Configured on request | Static updates on a map | Crews and resources move sooner |
BES delivers the outage data. Alerts, drive-time routing, or anything else your team needs can be configured on top of it at your agency's request.
How teams use the outage feed
Alerts in these examples are configured on top of the feed, at each agency's request.
Regional situational awareness
Regional situational awareness
- Scenario
- A storm knocks out power across several counties overnight.
- In ArcGIS
- An ArcGIS Dashboards view shows live outage polygons over critical infrastructure such as hospitals and shelters, socially vulnerable populations, and the total residents affected in each jurisdiction or locality.
- Impact
- The operations center sees scope and spread at a glance and sends support to dark critical facilities first. Alerts are targeted to the affected neighborhoods.
Fire and police response
Fire and police response
- Scenario
- Streetlights and alarm monitoring go dark across several neighborhoods.
- In ArcGIS
- Outage polygons on the dispatch and real-time crime center dashboards sit over patrol routes and first-due areas, with an alert when an outage covers a high-risk zone.
- Impact
- Patrols move into the dark areas, and fire units know which blocks are dark, and which buildings lost monitored alarms, before they leave the station.
Cross-disciplinary coordination
Cross-disciplinary coordination
- Scenario
- An outage takes in a water treatment plant, putting drinking water at risk.
- In ArcGIS
- Outage polygons over treatment plants and pump stations show the downstream impacts, with alerts to both utilities.
- Impact
- The energy provider and the water provider agree on which locations are critical for early power restoration, so one failure doesn't cascade into the next.
Cascading risk at a data center
Cascading risk at a data center
- Scenario
- A substation outage threatens a data center whose cooling water depends on a treatment plant on another grid.
- In ArcGIS
- Outage polygons from both service territories over the campus and the plant, with an alert when both go dark at once.
- Impact
- Operators switch to backup systems before cooling fails.
A live outage layer, delivered straight into your ArcGIS
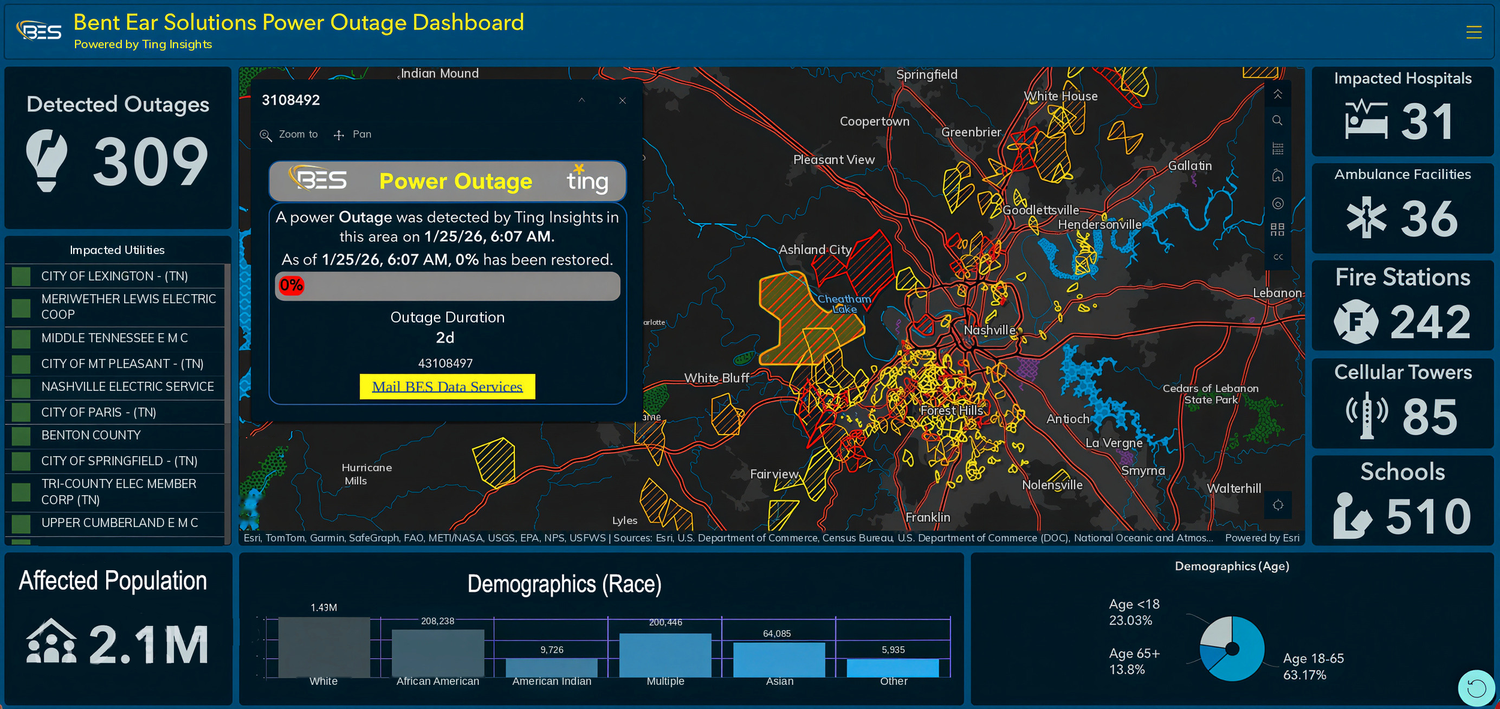
The real footprint
Each outage shows as a polygon over the blocks that are dark, refreshed about every 30 seconds.
Next to what you protect
Your hospitals and shelters sit under the outage layer, with totals by jurisdiction.
Licensed per agency. BES hosts and supports every layer.
Questions about the Power Outage feed
About every 30 seconds. The feed refreshes active outage polygons as the sensor network reports changes, so your dashboard shows where power is out now, not where it was an hour ago.
Outages arrive as GIS polygons that trace the affected blocks, not county or ZIP code totals. A sensor sits within a mile of about 95 percent of US homes, so the polygons follow the real footprint.
It comes from an independent sensor network that runs across utility boundaries. It's a backup or second source when utility maps are overloaded or down, often just when they're needed most, and it fits more easily into your agency's GIS.
ArcGIS Online, ArcGIS Enterprise, and ArcGIS Pro. The feed arrives as an authenticated feature layer, so your team can add it to ArcGIS Dashboards, Field Maps, Experience Builder apps, and web maps, or analyze it in ArcGIS Pro.
Yes. The outage polygons are a standard feature layer, so they sit alongside your critical facilities and population data. Spatial joins work as they do on your own layers, which is how teams rank at-risk neighborhoods or list every dark facility.
Yes. Declared disasters are when agencies lean on the feed most. BES hosts the layers in its cloud ArcGIS Enterprise, so the load never lands on your servers, and uptime and support terms are part of each agency's license.
Yes. Request a demo and BES walks your team through the live feed in ArcGIS, so you can see the layers before you license them. Interested in a trial? Contact us to learn more.