


Comprehensive Utilities Support


Technology Assessment & Optimization
GIS-Based Decision-Making Support
Operations & IT Alignment
Data Management, Collection & Integration
Work Management Process Improvement
Operational Planning & Workflow Enhancement
Staff Augmentation - Full-Time & Emergency
Everyday Operations
End-to-end Situational Awareness
Hazard & Risk Exposure Assessments, Scoring, & Mapping
Emergency Procedure & Process Improvement
Contractor Management Support
After Action Report (AAR) Development
Emergency Response Visualization
Response & Resilience
Emergency & Crisis Management
Disaster Planning & Response
Simulation Development & Technology Alignment for Training and Exercises
Nuclear Protective Action Zone (PAZ) & Emergency Planning Zone (EPZ) Modeling
Crisis Plan Development and Training
Comprehensive Threat Management
Personnel and Organizational OSINT Threat Monitoring
Everyday Operations
We don’t sell software. We work with your existing technology and the data that matters to you, creating tailored solutions that address your specific needs and advance your mission.

Customize your software for your unique operations
everything you need
all in one place
See your entire grid and workforce at a glance. A unified dashboard brings together operational systems for real-time crew visibility, mutual aid tracking, and asset monitoring—all aligned with your workflows. Transform data into action by connecting technology, processes, and people in one sleek, intuitive view.

CLIENT CENTERED SOLUTION
Dominion Energy - VA
Understand your service area at THE STREET LEVEL
Go beyond a sleek dashboard and dive into the operational details. With granular data down to individual work requests, vehicle deployment, outage locations, and customer impact, BES empowers utilities to move from broad awareness to precise, confident action.
Explore generation impact
achieve faster & simplified Regulatory compliance
For a multi-state ISO, BES created a Generation Simulation Application. The application provides interconnection customers and engineers with estimates of grid congestion at given points based on your inputs. Better understand a variety of generation injection and withdrawal scenarios and predetermine their effects on the grid.

seamless COLLABORATION PLATFORM INTEGRATIONS
BES meets you where you work. Monitor your assets with confidence using a streamlined dashboard seamlessly integrated into your collaboration platform (MS Teams, Slack, etc.). With heightened situational awareness, maintain a deep understanding of your service area and system status anytime and anywhere.


Explore comprehensive operational awareness
Don’t get caught off guard — align your existing technology, procedures, data, and personnel to achieve an actionable understanding of threats and hazards that impact your operations. Maximize efficiency by leveraging historical metrics and trends to inform adaptive and robust risk management strategies.
Response & Resilience


The data you need, in the format you need it in.
Build confident resilience with all-hazards planning
Strengthen your readiness with real-time weather, flood, and wildfire intelligence, paired with BES expertise in operational protocols and situational awareness. From PSPS events to asset protection, BES helps utilities make faster, smarter decisions when every second matters.
Deeply understand your risks through scoring, assessments, and spatial mapping
Monitor wildfire and grid conditions in real time with data from environmental sensors, weather tracking, and ignition models
Develop and rehearse operational protocols like PSPS and crew deployment to enhance rapid response capabilities
Build tools that support continuity of operations, informed by critical data, and designed to solve your unique challenges and risk profile
Whether you're preparing for an approaching storm or monitoring high-risk wildfire conditions, BES empowers your team to act with confidence—mitigating risk, enhancing service reliability, and protecting critical infrastructure.

rapidly respond with real-time insights
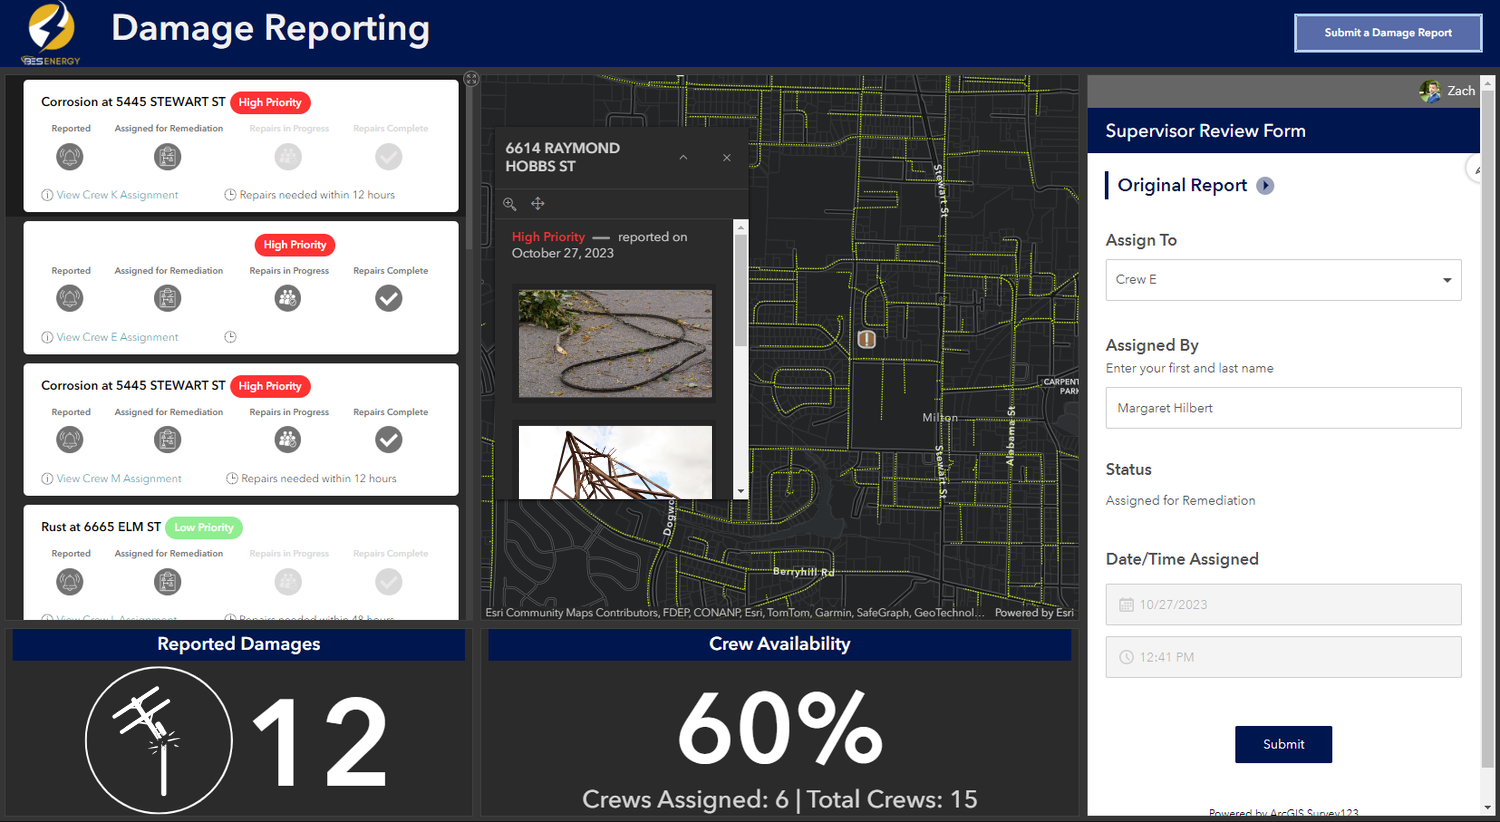
Prioritize and coordinate seamlessly across workflows and operating units when disruption strikes. A unified dashboard—accessible on any device—keeps asset status, response priorities, and dispatch actions in sync. Ensure clear communication and shared awareness so every team member stays aligned, informed, and ready to act.

Weather threats don’t wait, and neither should you
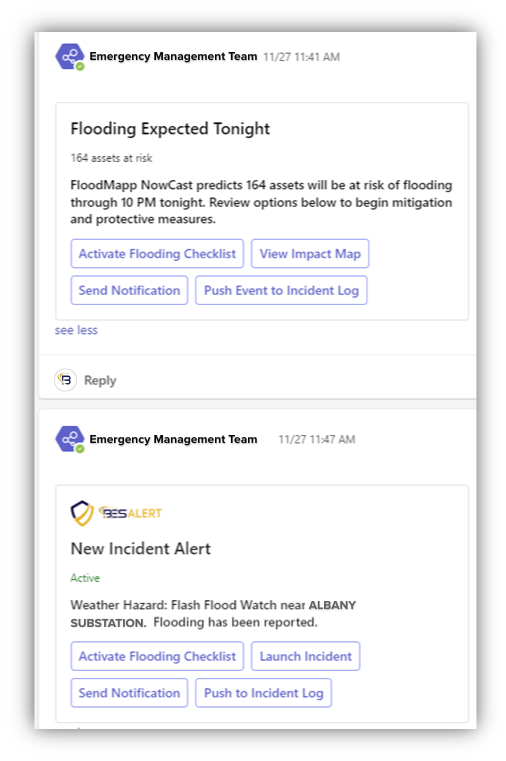
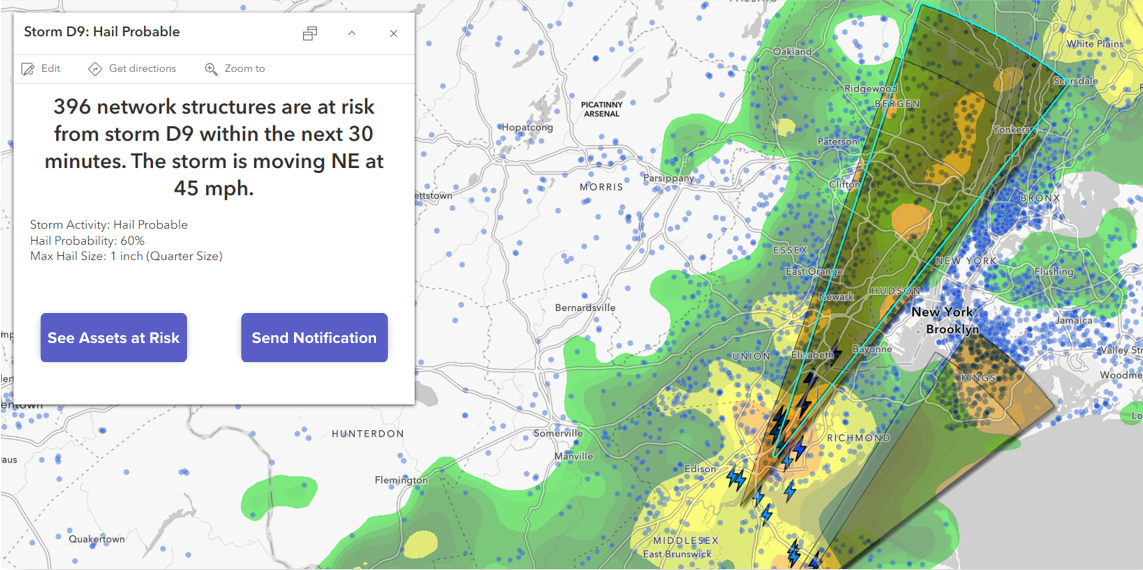
Stay ahead of fast-moving weather threats with live, map-based storm tracking and impact projections that are directly integrated into your operational workflows. Whether there’s hail, wildfire conditions, flooding, or flash freezing conditions, our solutions enable you to pinpoint exactly which assets and infrastructure are at risk—before the damage occurs.

Instantly visualize which areas and assets fall within the path of hazardous weather.

Quantify exposure in real-time, from network structures to substations and field crews.

Trigger pre-configured notifications to internal teams or external stakeholders via your preferred communications system.
Project spotlight: DE_CIPHER
The DE-CIPHER application is a GIS-based operating capability that functions as an incident response management system, a situational awareness monitoring platform, and a historical data repository for trends and analysis. These products support physical security and threat intelligence by consolidating, visualizing, and analyzing data vital to the security of Dominion Energy’s physical assets and personnel.

Disaster Prevention & Training
How we help you build your resilience:
Custom Planning & Information Sharing Development
Ensure that your plans and information needs are complete and aligned, supporting operational and executive decision-making.Processes and solutions built specifically for you
Simulations, workflows, procedures, and technology-based capabilities, ranging from collaboration platforms to GIS and emergency notifications, BES brings it all together.Cross-Functional Tabletop Facilitation
Break down silos between operations, IT, communications, and executive leadership through structured, facilitated engagements.After-Action Reviews with Real Takeaways
We don’t leave you with a generic summary. BES delivers prioritized, actionable improvement plans that help your teams evolve and enhance their performance.

earn confidence before the crisis
Bent Ear Solutions provides plan review and development, training and tabletop simulations, and After Action Reviews (AARs) for utility organizations, ensuring alignment between updated processes and workflows, essential elements of information (EEIs), technologies, and regulatory environment. From executive-level tabletop briefings to comprehensive consulting services, we help you move beyond checkbox compliance and into true operational readiness.
Tabletop exercises aren’t just about procedures.
They’re about your people & community.
Protective Action Zones (PAZ) at Your Fingertips

A real solution to our nuclear partner’s problem.
To provide actionable guidance on protective actions, BES addressed a nuclear partner’s challenge by developing the Protective Action Application, designed for nuclear facilities and surrounding jurisdictions. This geospatial solution visually delineates Protective Action Zones (PAZ) in real time, providing instant clarity on who needs to shelter, evacuate, or take protective measures based on the evolving incident.
Visualize the unthinkable
Leveraging their existing technology to do more.
The app leverages the partner’s existing technology to support meteorological modeling, threat plume projections, and pre-defined evacuation sectors to generate highly accurate visualizations of hazard zones. Whether in Drill Mode to lead training or during a real-world event, stakeholders can quickly communicate protective actions to the public, coordinate across agencies, and manage logistics—without guesswork or delay.

emerging capabilities


Leverage AI for Change detection
Transform how you monitor and manage your assets with advanced AI-powered change detection. Detect anomalies, anticipate maintenance needs, and respond proactively to potential threats with enhanced decision-making and situational awareness.


Stay Current: Our Expert Insights
We Hear Your Potential

We Ensure Continuous Connection
Our team is always studying the latest technologies and is aware of upcoming updates to ensure your technology never skips a beat.

We Support Sustainable Success
We develop plans, policies, and procedures to integrate our innovative solutions into your everyday operations without a hitch.

We Lead with Listening
Our unique process, The BESt Ear Way, starts with listening to your challenges and goals, allowing us to do precisely what you need us to.
Our Partners in Power