


You have the plan
‣‣‣
You have the technology
‣‣‣
Let’s bring it all together
‣‣‣
You have the plan ‣‣‣ You have the technology ‣‣‣ Let’s bring it all together ‣‣‣


Technology Assessment & Optimization
GIS-Based Decision-Making Support
Hazard & Risk Exposure Assessments & Mapping
Special Events Preparation
Hazard Mitigation Planning (HMP)
Emergency Procedure & Process Improvement
Preparedness & Mitigation
Comprehensive Situational Awareness
Integrated & Actionable Alerts & Notifications
On-Site & Remote Disaster Operations Support
Disaster Response & Recovery Planning
Resource Tracking & Logistics Support
Response & Crisis Management
Disaster Recovery Modeling & Visualization
Inter-Agency Data Management & Information Sharing
After Action Report (AAR) Development
Optimized Damage Assessment & Field Reporting
Stakeholder & Public Engagement
Disaster Recovery
Preparedness & Mitigation
Purpose-built for your needs from day to day to disaster.
We partner with your team to make your existing tech work smarter, aligning your current systems with the information and support needed to elevate resilience, response, and recovery operations.

Deeply understand the unique risks and demographics of your community
SEE your RISKS.
UNDERSTAND THE IMPACT.
Go beyond generalized dashboards—operationalize your emergency management strategy with precision tailored to your unique environment and risks.
For the San Francisco Bay Area UASI, BES designed this Regional Resilience Tool that brings together:
Granular demographic insights
Real-time hazard exposure
Categories of burden
Community risk scores
Localized social vulnerability metrics

Equip your EOC with the data clarity needed to prioritize resources, target interventions, and protect your most at-risk communities, before, during, and after disasters.

Make your EOC run smoother by combining your disparate systems
Go from disparate systems to a
common operating picture
Event readiness demands speed, clarity, and collaboration. BES configures your existing systems to communicate with each other, combining alerts, GIS, sensors, and any other data that matters to you into a single, actionable interface. With live updates, customizable zones, and alert status indicators, our custom solutions ensure emergency managers are never caught off guard.
Everything gets easier when your technologies work together.

Response & Resilience
Accelerated response built into Microsoft Teams
BES meets you where you work, creating solutions that feel familiar and promote long-term adoption and sustainability.
This approach enables organizations to:
Monitor critical infrastructure and dependencies with confidence using a streamlined dashboard seamlessly integrated into your collaboration platform (MS Teams, Slack, etc.).
Start emergency workflows and coordinate on a dime
Mobilize incident response teams
Notify stakeholders and impacted communities
All in a unified & familiar platform.

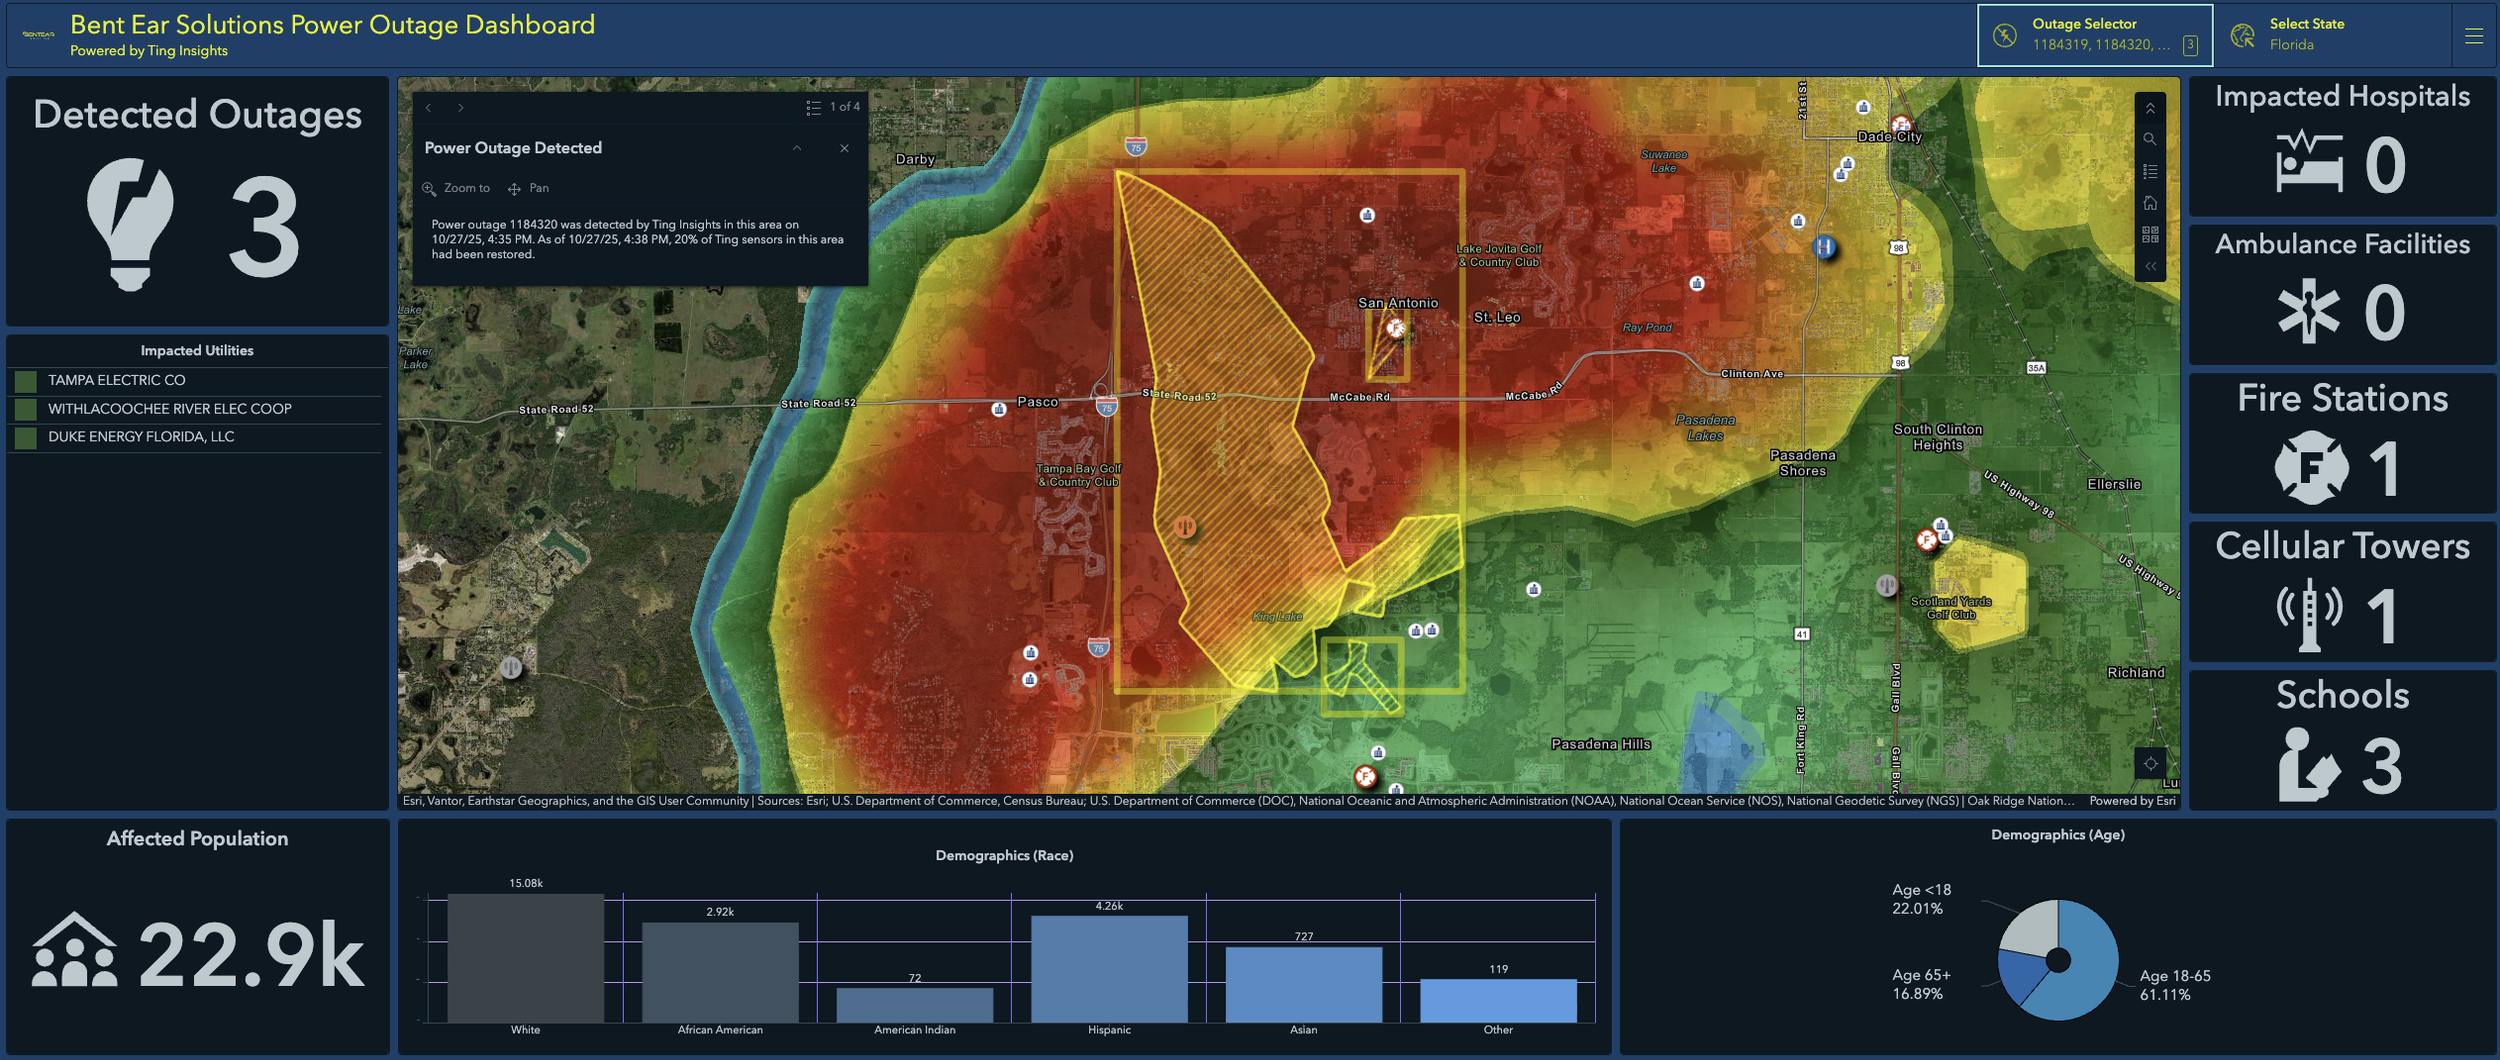
Level-up your situational awareness with unrivaled grid intelligence

Instantly visualize which communities and critical dependencies are impacted, down to the street level.

Quantify impact in real-time, with swiftly updating outage data aligned with demographics and critical infrastructure.

Trigger preconfigured notifications
when vital public resources, such as hospitals, go off the grid for too long.
Power disruptions are a crisis
BES provides geospatial intelligence for Whisker Labs’ innovative Ting Insights. Their revolutionary, real-time outage data is powered by 1M+ sensors covering 94% of the U.S. This unprecedented sensor coverage makes Ting Insights the industry-leading source for geospatial power outage data.

Visualize community support in real-time
Empower your team to:
Monitor real-time incidents like evacuations, rescues, and critical infrastructure disruptions
See shelter status, staffing needs, and occupancy levels as situations evolve
Track Points of Distribution and community lifelines to ensure aid reaches the people who need it most
See granular power trends, down to the street level, road closures, and flooding, impacting mobility and safety
VISUALIZE Community Aid & Recovery in Real-Time
Track every step of recovery from evacuation, shelter relocation, and critical supply distribution. We work with you to configure and optimize your existing technology and workflows, improving efficiency and effectiveness at every stage of recovery.
Disaster Recovery

Our Work with the City of Los Angeles Supporting the Palisades Wildfire Recovery
Initial Damage Inspection visualization
When devastating wildfires broke out across the City of Los Angeles, they were faced with unprecedented damage, debris, and displaced families across their communities. BES supported their vital recovery efforts through geospatial visualization, helping build dashboards like the one above, which is built on Cal Fire’s initial damage inspection data.
Real-time Recovery tracking
BES supported impacted property owners by visualizing the damage to their properties and the progress of restoration efforts, including debris removal and cleanup, through the design and publication of two public dashboards. To support decision-making for LA’s public safety leaders, BES built an internal dashboard that provided a common operating picture and ensured an efficient and equitable recovery across the community.
Click the images to explore the live dashboards!

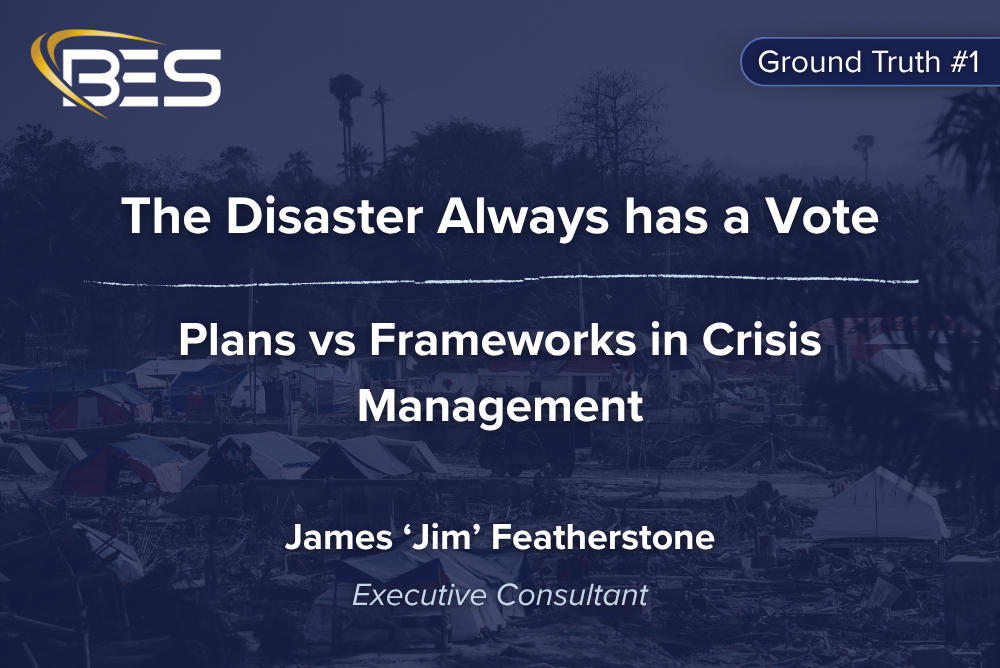


Insight From our EM Experts
We Hear Your Potential

We Ensure Continuous Connection
Our team is always studying the latest technologies and is aware of upcoming updates to ensure your technology never skips a beat.

We Support Sustainable Success
We develop plans, policies, and procedures to integrate our innovative solutions into your everyday operations without a hitch.

We Lead with Listening
Our unique process, The BESt Ear Way, starts with listening to your challenges and goals, allowing us to do precisely what you need us to.